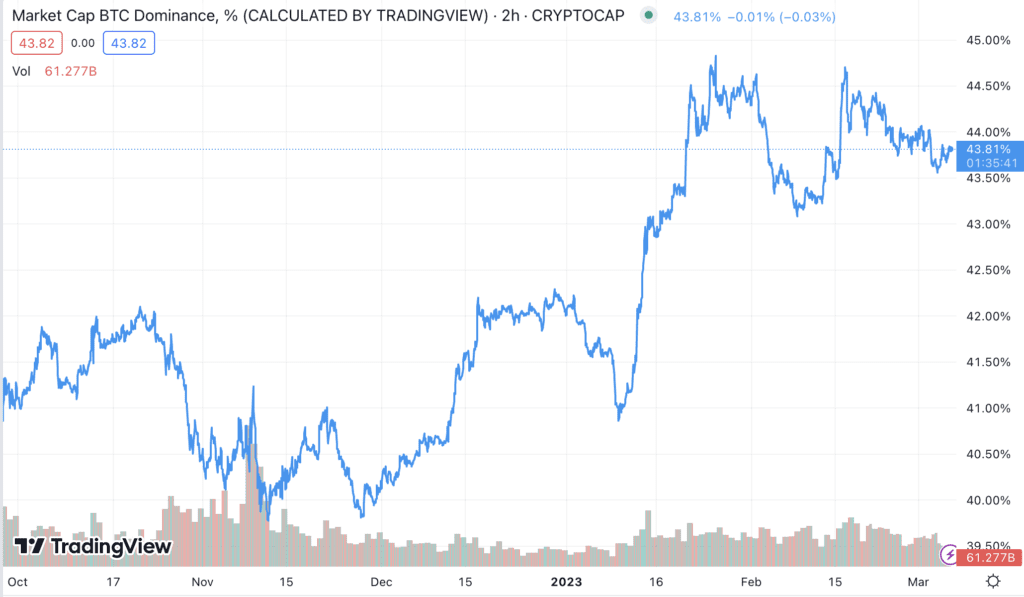
In this article, we’ll learn about the Bitcoin Dominance Chart, how to read it, and how to apply it to your cryptocurrency trading.
In recent years, the use of cryptocurrencies has experienced a meteoric rise in popularity, with Bitcoin serving as the frontrunner in terms of being the largest and most well-known cryptocurrency. Understanding how to conduct data analysis, such as looking at the Bitcoin Dominance Chart, is essential in order to be able to make educated trading decisions in light of the ongoing evolution of the market. In this piece, we’ll discuss what the Bitcoin Dominance Chart is, how to read it, and how to put it to use when trading cryptocurrencies.
Meaning of the Bitcoin Dominance Chart:
The Bitcoin Dominance Chart is a metric that displays the proportion of the total market capitalization for cryptocurrencies that are held by Bitcoin. It examines Bitcoin’s market capitalization in relation to the total market capitalization of all other cryptocurrencies. This chart presents a method for gaining an understanding of the current state of the cryptocurrency market as a whole, particularly in relation to Bitcoin.

How to Read Bitcoin’s Market Share Graph
Traders and investors interested in the cryptocurrency market can use the Bitcoin Dominance Chart to their advantage. Some things to keep in mind when deciphering the graph are as follows:
- Overall Market Health: Generally speaking, a bearish market is indicated by a rising Bitcoin Dominance Chart, while a bullish market is indicated by a falling chart.
- Altcoin Performance: A decline If the Bitcoin Dominance Chart is falling, that usually means that alternative cryptocurrencies are doing well, while the opposite is true if Bitcoin is outperforming them.
- Market Sentiment: The Bitcoin Dominance Chart provides insight into the market’s general attitude towards Bitcoin and other cryptocurrencies.
Use Its Strengths in the Market:
Bitcoin traders can use the Bitcoin Dominance Chart in a number of different ways. To that end, consider the following methods:
- Long Bitcoin/Short Altcoins: You can speculate that Bitcoin will outperform alternative cryptocurrencies by going long on Bitcoin and short on alternative cryptocurrencies. Margin trading platforms are a viable option for implementing this strategy.
- Long Altcoins/Short Bitcoin: If you believe that altcoins will outperform Bitcoin in the future, you should consider going long on alternative cryptocurrencies and short on Bitcoin. In addition, margin trading platforms can be used to put this strategy into action.
- Diversify Your Portfolio: You can diversify your cryptocurrency portfolio with the help of the Bitcoin Dominance Chart, which provides data on the relative value of Bitcoin and other cryptocurrencies. For instance, if the chart is pointing to a bullish market, you might want to think about diversifying your portfolio by investing in additional altcoins.
FAQs:
Q. What is the current Bitcoin Dominance Chart reading?
Bitcoin’s share of the market has reached 43.81% as of 6th March 2023, according to the Dominance Chart.
Q. Is the Bitcoin Dominance Chart a reliable indicator of the cryptocurrency market’s overall health?
If you want to know how the cryptocurrency market is doing as a whole, look no further than the Bitcoin Dominance Chart.
Q. How often is the Bitcoin Dominance Chart updated?
The Bitcoin Dominance Graph is dynamic and constantly updated in real time.
In conclusion, When it comes to trading cryptocurrencies, the Bitcoin Dominance Chart is a useful tool that can assist you in making decisions that are based on accurate information. You can gain a significant advantage in the market if you know how to read and trade based on the chart, and if you also understand how to interpret the chart. You should keep an eye on the Bitcoin Dominance Chart regardless of whether you are an experienced trader or just starting out. This metric is important.


Discussion about this post