- XRP on the brink of a major price shift due to an impending breakout from a descending triangle pattern.
- Examination of support, resistance levels in XRP’s technical analysis suggests potential price volatility and directional changes.
Decoding XRP’s Crucial Chart Formation
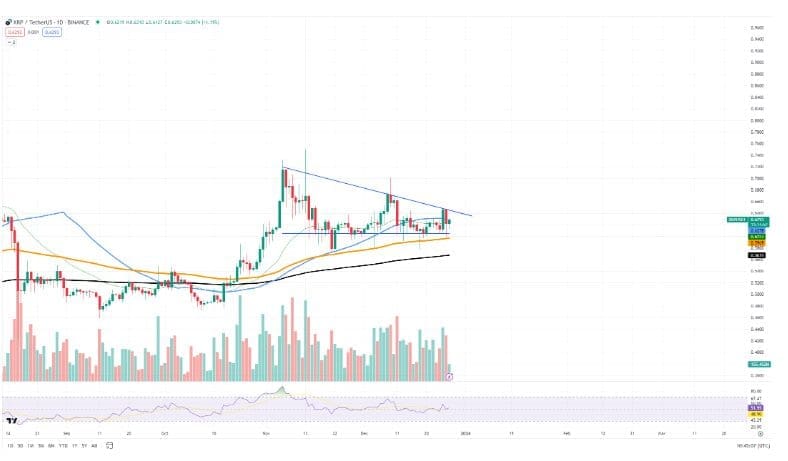
On December 29, XRP, the digital asset often associated with Ripple, is poised at a critical juncture that could signal a substantial change in its trajectory. The anticipation stems from an intriguing technical aspect: a formation observed in the XRP/USDT price chart that hints at an imminent breakout from a descending triangle pattern.
Analyzing XRP’s Chart Dynamics
The chart analysis indicates the presence of a descending triangle on XRP’s daily chart, characterized by a horizontal lower boundary acting as a sturdy support level and a declining upper boundary symbolizing descending resistance levels. Typically, this pattern denotes accumulation during a phase of uncertainty, as the price consolidates towards the convergence of these boundaries. As XRP nears this convergence point, the probability of a decisive movement amplifies.

Also Read: Ripple (XRP) Forecast: Predictions of 100% Surge Pre-Bitcoin Halving
Key Support and Resistance Levels
For XRP, maintaining above the crucial support level at approximately $0.55 remains pivotal. This level has exhibited resilience against bearish pressure in previous instances, potentially strengthening the case for an upward breakout. Conversely, a breach below this crucial support might drive XRP’s price down, testing lower support regions around the $0.50 zone, historically a zone with notable buying activity.
Resistance levels also play a crucial role. Immediate resistance near the upper boundary of the triangle lies around $0.63. A robust breakthrough beyond this resistance could propel XRP’s price towards the $0.65 level, a zone characterized by previous price congestion. Surpassing this mark might pave the way for testing higher resistance levels, possibly around $0.70.
Navigating Market Expectations
As the December 29 date approaches, a palpable tension builds up, surging volatility levels. This anticipation hints at intensified market activity post-holiday season, considering that breakouts from such patterns often trigger swift and significant price movements. Investors brace themselves for a potential bullish validation if an upward thrust occurs, while a downward break necessitates a reevaluation of medium-term sentiments.


Discussion about this post