
Buying cryptocurrencies is a good investment, but just like every investment, there are modalities. As a cryptocurrency investor, you need to know what cryptocurrency to buy and when to buy them.
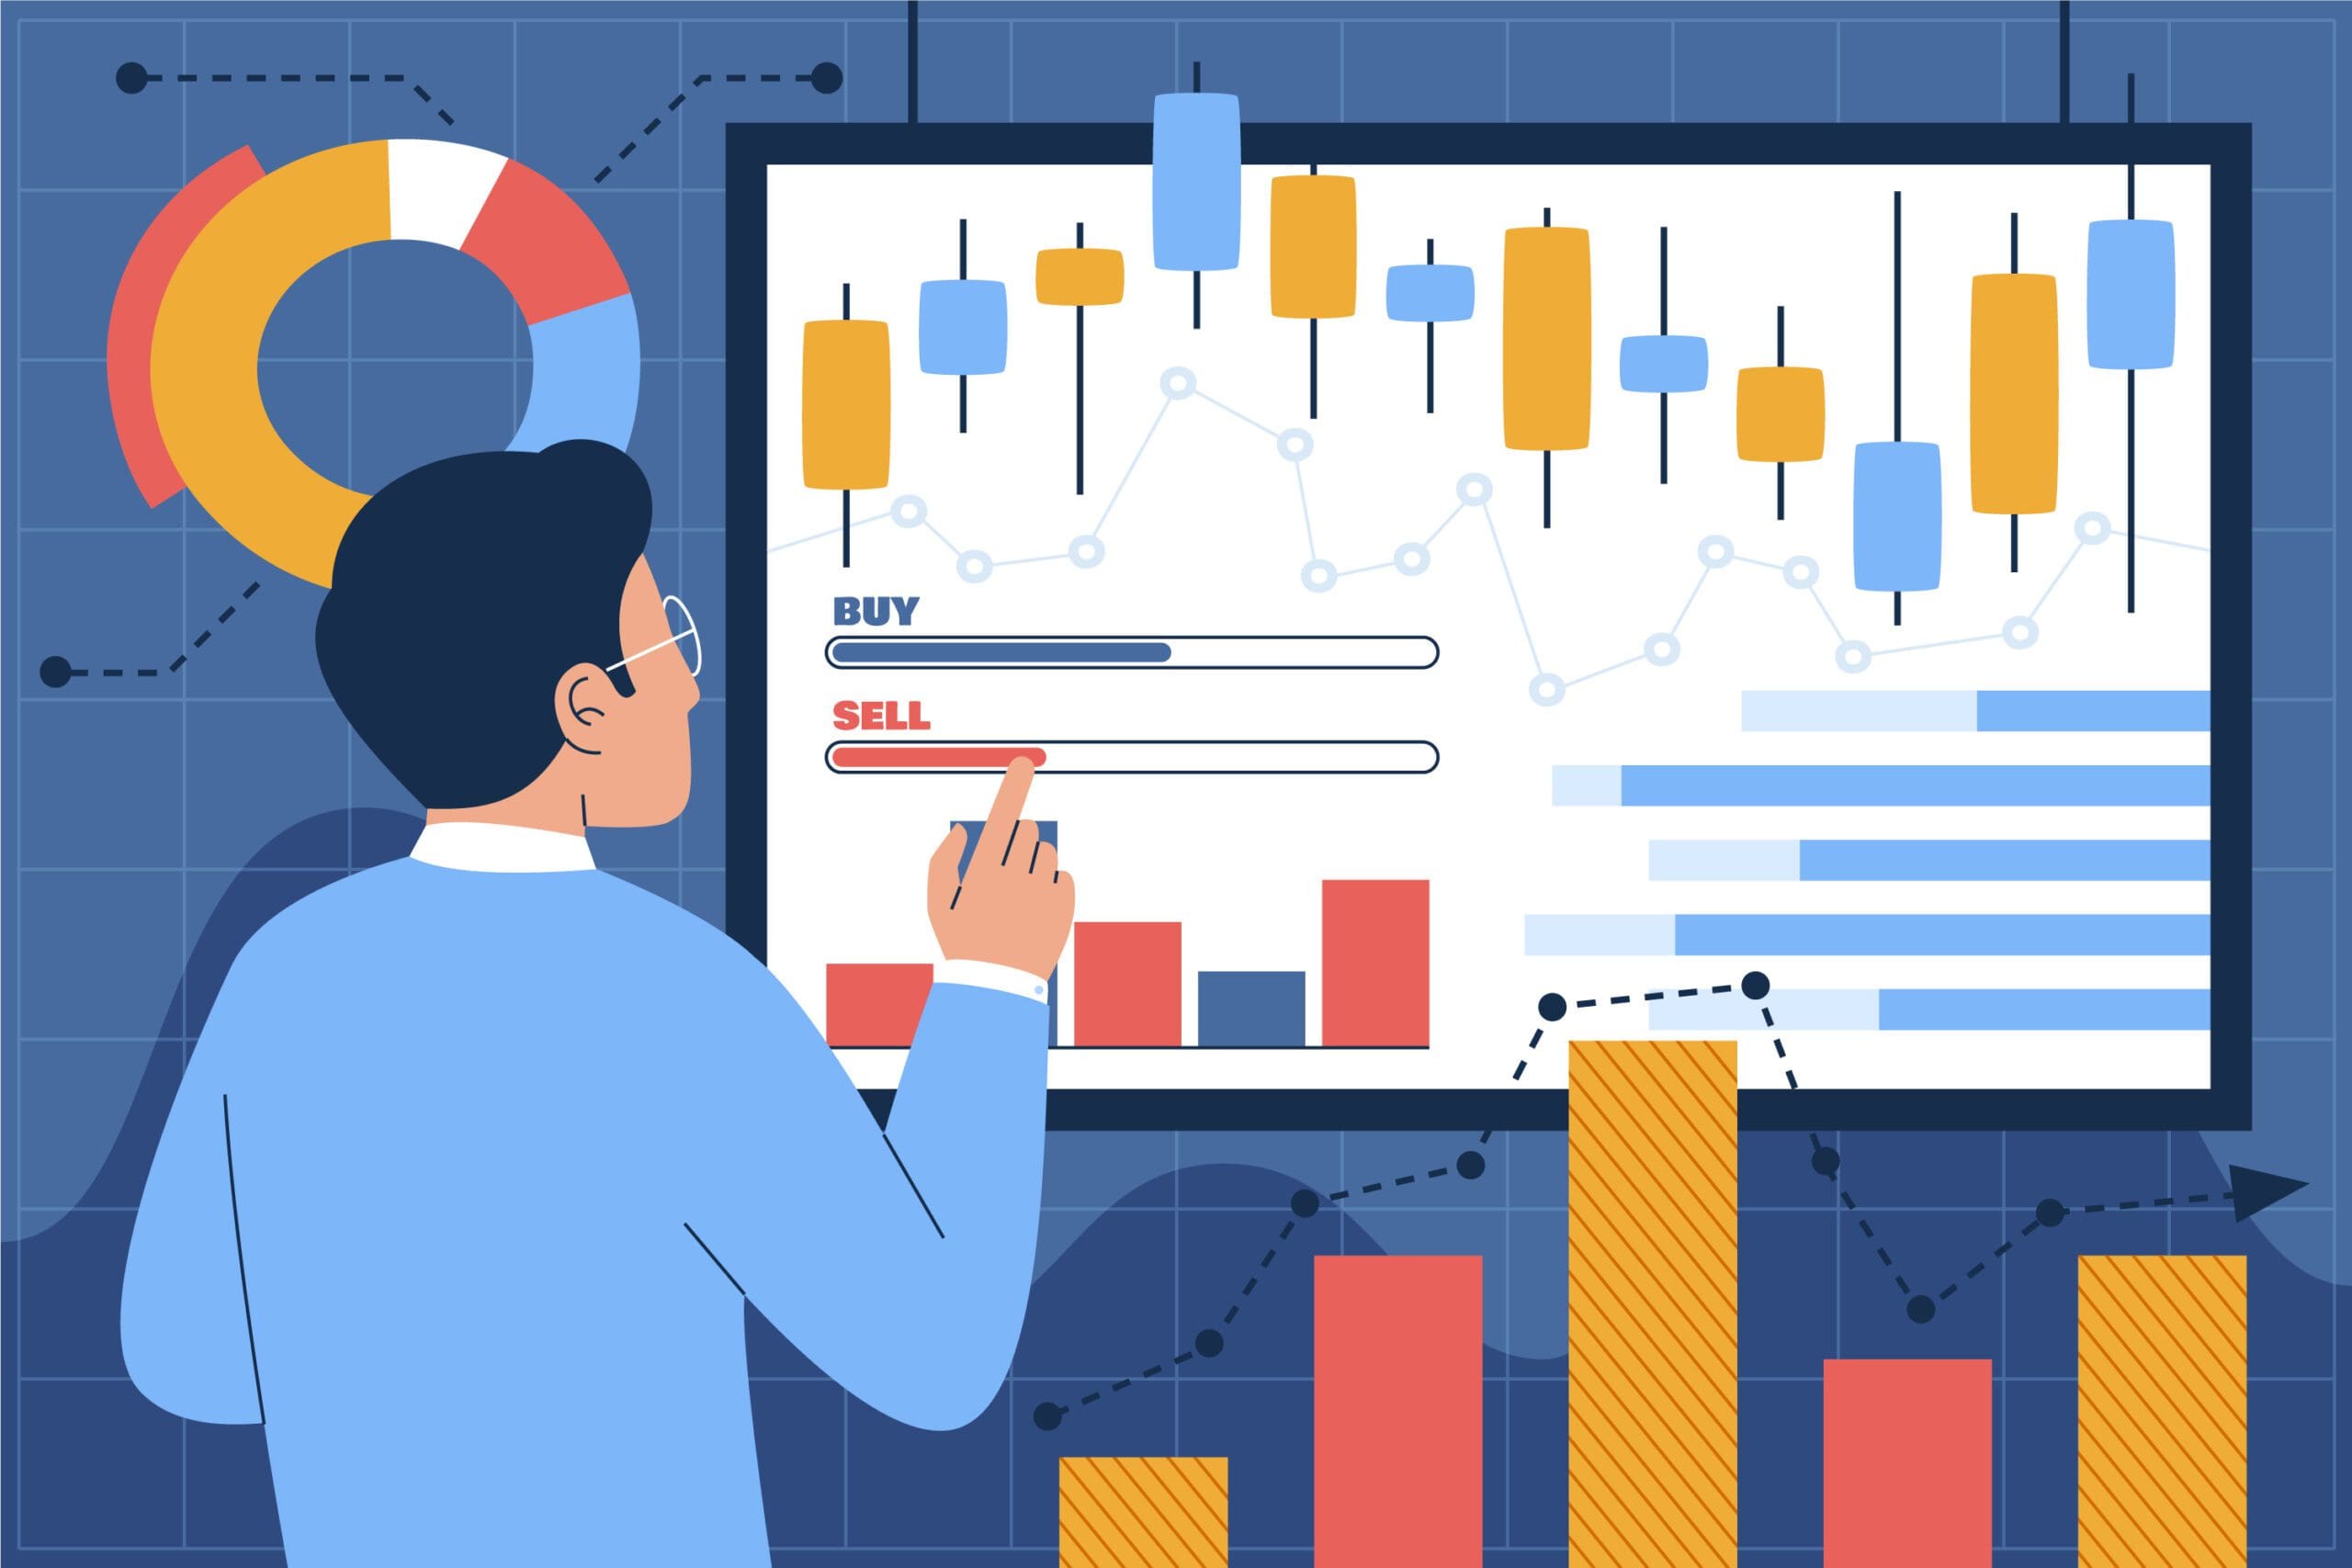
When you start doing your research about the cryptocurrency to buy, you may find a special type of graph showing prices. Another name for this price graph is the candlestick chart. Experienced cryptocurrency investors use these candle sticks to know the cryptocurrencies to buy.
Now, if buying and when to buy is dependent on knowing how to read candlesticks, then every crypto investor needs to know how these candlesticks work. Just like the bar and line graphs you know, the candlesticks display time and data price across the axis horizontally and vertically.
The only difference between the candlestick chart and the other popular less complex graphs is this: candlestick graphs carry more information. When you look at a candlestick chart, you can see the highest and lowest price within a particular time.
In addition, candlestick charts will show the prices (opening and closing) of digital assets.
What is a Candlestick Chart?

By looking at a candlestick, you can tell at one glance the movement of crypto prices in the market. The candlestick chart will tell you if the movement in price was in the negative or positive direction. Furthermore, you can tell the degree of the price movement by just glancing at the candlestick chart.
There represented timeframe in a candlestick chart can have a large variance. For example, Coinbase Pro’s default time frame is six hours. Each candle in this six hours time frame represents a slice of five minutes. Although, as a user, you can set it to either see it longer or shorter.
Very importantly, crypto markets are not like the stock markets. The stock market has opening and closing times daily but the crypto market is always open 24/7. Therefore, the opening and closing price of the crypto market will be the prices of crypto assets at the start and end of a particular time frame.


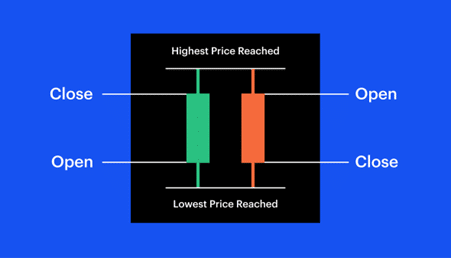
- When the candlesticks are green, it means that the prices are going up. It means that the top of the candle is the ‘open’ and the down of the candle is the ‘close.’ When the candlesticks are red, it means that the prices of the crypto assets are going down, and it means that the top of the candle body is the ‘open’ and the bottom is the ‘close.’
- Every candle has two parts, the wicks, and the body. The candle body shows you the opening and closing prices of the crypto assets within the timeframe of the candle.
- The lines stretching out from the body of the candle at the top and the bottom are called the wicks. The wicks show the prices (highest and lowest) the asset got to within the trading time frame.
Do Candlesticks Have Messages for Traders?
There is more to a candlestick than just showing the price movements of crypto assets within a particular timeframe. Traders who are experienced look out for patterns formed by the candlestick so they can know the sentiments of the market and make predictions about the direction of the market.
Below are some of the things traders look out to see on candlesticks:
- When there is a long wick at the base of the candle body, it could mean that the prices fell and traders are buying more, and it may be a good sign that the prices are about to go up again.
- When the wick at the top of the candle is long, it could mean that traders are looking at taking profits, and it could mean that you should start selling off.
- If the body of the candle occupies almost everywhere showing little or no wick at the top or bottom of the body, then it could be a sign of a bullish or bearish movement. If it happens on a green candle, the market might get bullish anytime soon, for a red candle, it could mean that the market may get bearish anytime soon.
Having a good knowledge of the meaning of candlesticks in a specific asset context or during a particular condition of the market is one of the elements of a strategy for trading called Technical Analysis.
Investors use this trading strategy to identify the direction of the market by looking at the price movements in the past. By looking at the price movements of assets in the past, traders can spot trends and opportunities that may occur in the future.
Reading “One-candle Signals”
One candle signal is what traders who want to trade for a short time frame use. These kinds of traders just focus on one candle. As a beginner crypto investor or trader, getting to know these “one candle signals” can be a very good exercise for you. The image below shows a picture of one candle signal.

- When the upper shadow is long, it could mean that a bearish trend is on the way. Investors are soon going to take their profits by selling off. The strength of an indicator is dependent on how long the upper shadow is.
- You see a long shadow below here, it could mean a bullish sign. The prices will go up because investors are trying to buy. The reliability of the signal is dependent on the length of the shadow.
- The third is a Doji Candle, it has no body. It means that the digital asset opened and closed at the same price within a given timeframe. A Doji candle shows that the market is indecisive, and this indecision could mean that there will be a price reversal soon. The name Doji is of Japanese origin, it means error, maybe because it is not common to see prices close at the same place that they opened.
- These candlesticks are called umbrella candlesticks. Their bottom wicks are distinctively long. Another name for the red umbrella is Hammer. When you see a hammer appear, it could mean that a serious buy action is happening with the asset, meaning that the prices might soon go up. On the other hand, the green umbrella shows that sellers want to make profits by selling off. Another name for the green umbrella is Hanging Men. It means that the prices of the assets may soon be on their way down.
Investors who are just starting in the crypto market should give their time to learning these candles and what they mean. It is good to begin familiarizing yourself with the signals of the one candle, but do not stop there.
To get a total understanding of the market, you will need to study the candles in a wider context. Spotting patterns and trends may not be easy at first, but practice makes perfect. Keep learning the candles and taking professional advice to know and master trading strategies that suit you.


Discussion about this post