


Summary
- On June 10, Fantom (FTM) witnessed a sizable lower wick, which was followed by an upward momentum that has been steadily building ever since.
- It is challenging to identify the trend’s direction due to the contradicting indications from the price action, RSI, and wave count.
- If Fantom (FTM) experiences an upward surge that pushes the price above $0.31, it would be a clear indication that a bullish trend is in play.
Over the last 11 days, the price of Fantom (FTM) has risen and avoided hitting a new bottom for the year.
The future movement is still uncertain based on the technical indicator readings. Although the RSI and price action are neutral or bearish, the wave count indicates that the correction is completed.
Fantom Bounces Back After A Huge Fall
Since hitting a lower high on April 18, the price of FTM has fallen. There haven’t been any noticeable bounces during the swift decline. This is viewed as an indication of weakness.
FTM dropped below the $0.34 horizontal area throughout the decline, which is now anticipated to act as resistance. On June 10, FTM hit a low of $0.21 before rebounding (green icon). Since then, the price has been rising.


The rally is supported by the weekly Relative Strength Index (RSI), which has not yet verified a bullish trend reversal. Traders use the RSI as a momentum indicator to assess market conditions, evaluate if a market is overbought or oversold, and decide whether to buy or sell a product.
If the RSI value is greater than 50 and the trend is rising, the advantage still belongs to the bulls. If the reading is below 50, however, the opposite is true.
The indicator is rising and has exited the oversold region (green circle), but it remains below 50. To declare a trend as bullish, there must be a clear advance over 50.
Is The Correction Complete For The FTM Price?
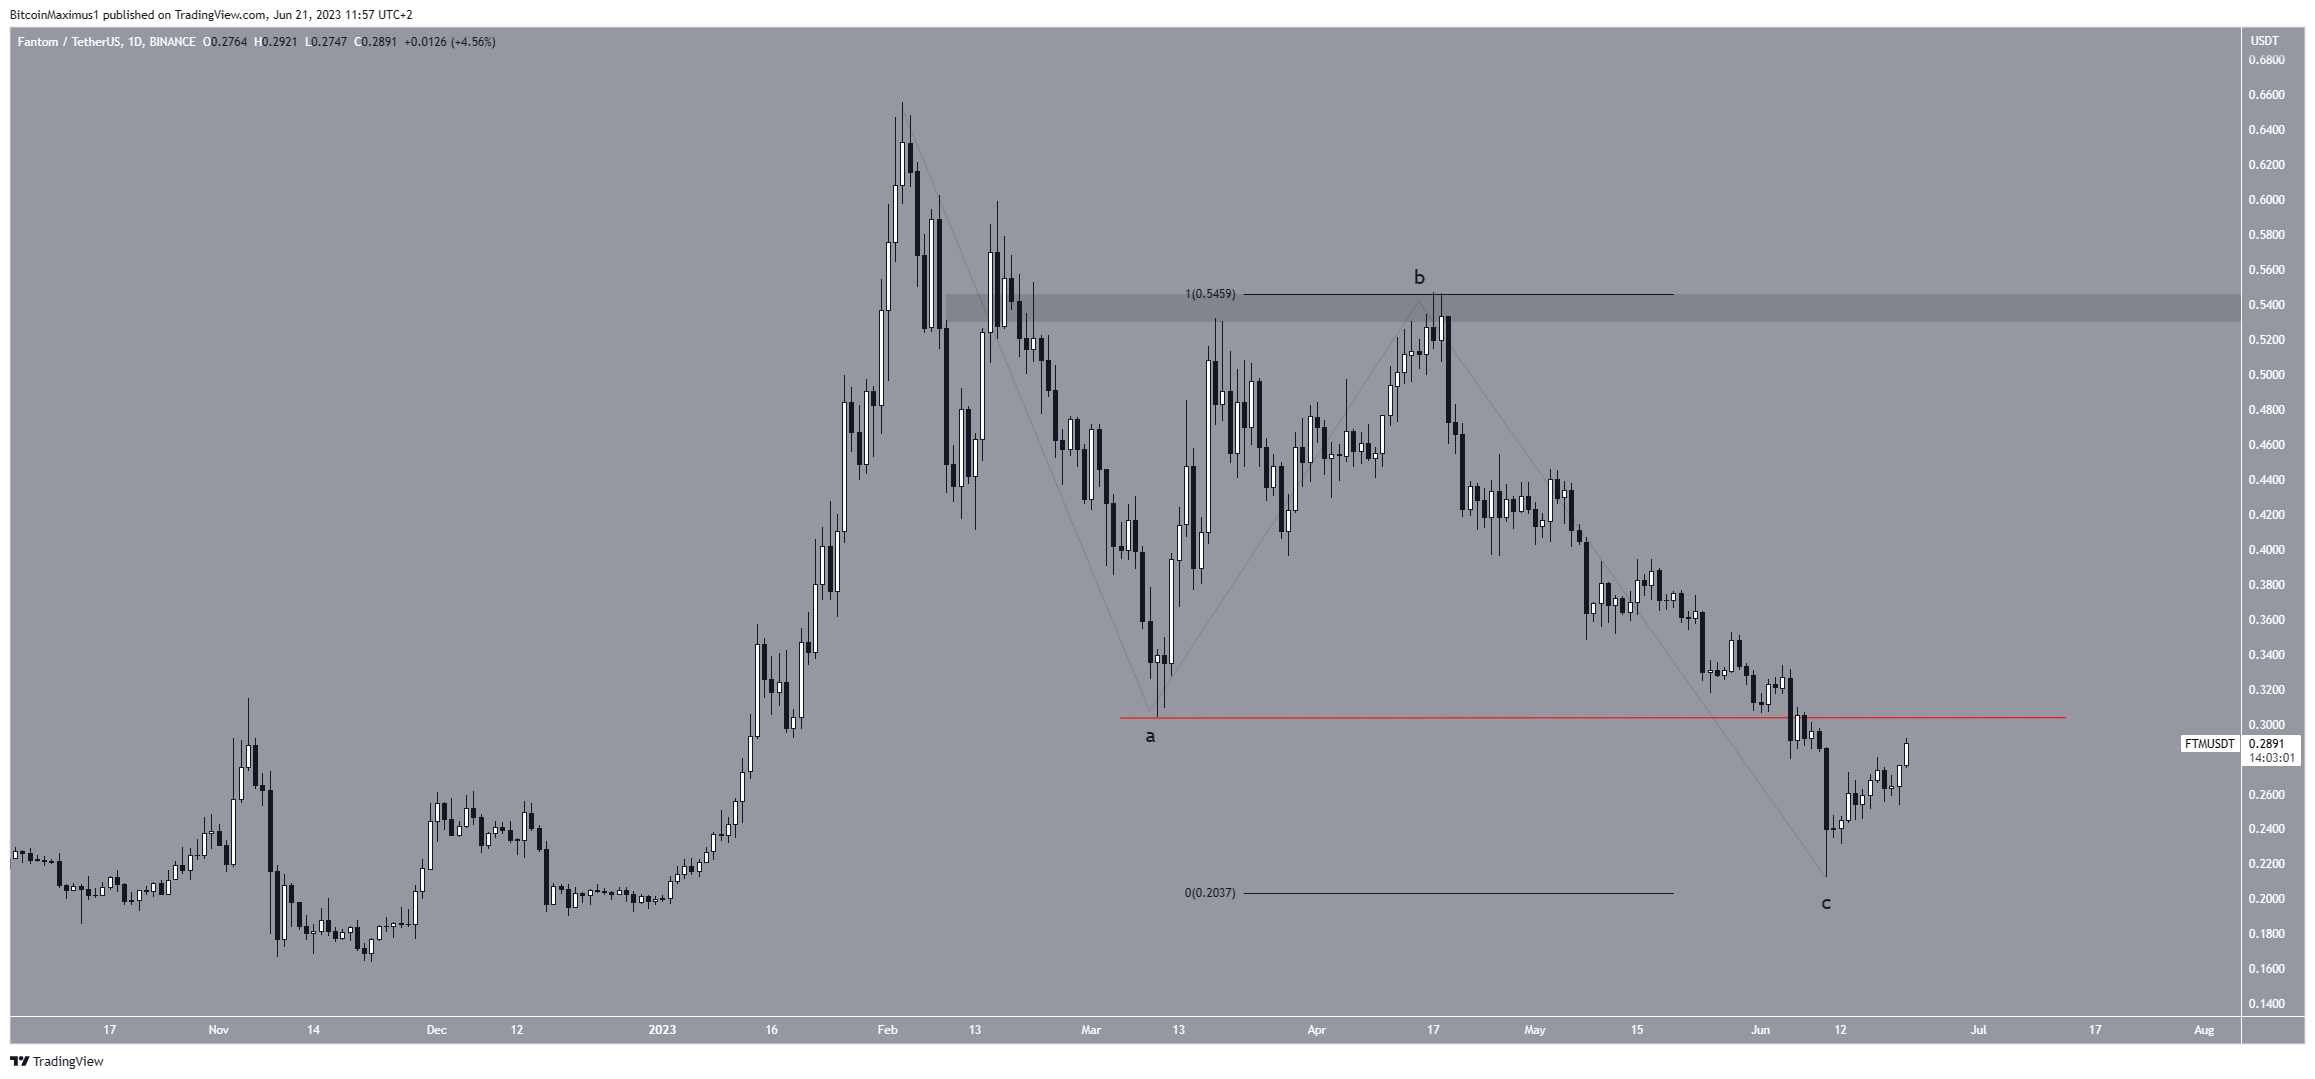
A closer look at the technical analysis for the daily time frame indicates that the A-B-C corrective structure (black) for the FTM price may have been finished.
Technical analysts utilize the Elliot Wave theory pattern to find recurrent long-term price patterns and investor psychology to determine the trend direction. The corrective structure is known as an Elliot Wave theory pattern.
The FTM price has completed its adjustment, and if the count is accurate, a fresh upward rise has begun. If FTM moves above the wave a low (red line) of $0.31, the pattern will be verified because the overlap would indicate that the decline was corrective.
Furthermore, the approximately 1:1 ratio between waves A and C lends support to the pattern.
If the count is accurate, the price of Fantom will rise to at least $0.54 and possibly reach a new high for the year.
Nevertheless, a decline below the low of last week ($0.31) will indicate that the trend is still bearish despite this positive FTM price forecast.
In such a scenario, the decline would carry on to a fresh annual low and the $0.10 range.
DISCLAIMER
This price analysis post is provided solely for informative reasons and shouldn’t be considered as investing or financial advice. Before making any financial decisions, always do your own research and seek professional advice.
Read more:
Litecoin Price Prediction: $100 Targeted As LTC Halving Approaches In Six Weeks