


Flags are one of the most popular technical analysis patterns that can give information about the price trend and prospective future moves.
A flag pattern in technical analysis indicates short-term price changes within a parallelogram that is in line with the previous long-term trend. Traditional analysts consider flags to be potential indicators of trend continuation.
There are two distinct flag patterns: the bull flag and the bear flag. Although the results vary, each flag demonstrates the basic characteristics outlined below:
- The powerful preceding trend (flagpole or pole)
- The channel for consolidation (the flag itself)
- The volume of trading patterns
- An outbreak
- An indication that the price is continuing in the same direction as its earlier trend.
- We go through bull and bear flag patterns in this article, along with trading strategies.
What does a bull flag pattern mean?
Technically speaking, a bull flag appears when the price settles lower within a downward-sloping channel following a strong advance. The aforementioned channel has two parallel, ascending trendlines. Please be aware that if the trendlines converge, the pattern could be either a wedge or a pennant.
During consolidation, volume often decreases, suggesting that traders who were involved in the prior trend are less compelled to purchase or sell at this time.


As the price breaks above the upper trendline of the bull flag, the urgency to buy by both new and experienced investors, or “FOMO” (fear of missing out), generally returns, boosting trading volumes.
Analysts interpret high volumes as evidence of a successful bull flag breakout as a result.
Low volumes at the time of the price crossing the upper trendline of the bull flag, however, increase the risk of a fakeout. In other words, if the price falls below the higher trendline, the bullish continuation scenario will be invalidated.
A Bull Flag Trading Setup
At the bottom of a bull flag, traders might open a long position in the hope that a breakout will occur when the price moves up again toward the pattern’s upper trendline. The more conservative traders can hold off on initiating a long position until a breakout is confirmed.
Typically, the price of the stock will increase by the size of the flagpole measured from the bottom as a result of a bull flag breakout.
A successful bull flag breakout setup is seen in the following Bitcoin price trend between December 2020 and February 2021.


As a word of warning, investors should keep their risks in check by setting a stop loss immediately below their entry levels. In the event that the bull flag is invalidated, that will allow them to cut their losses.
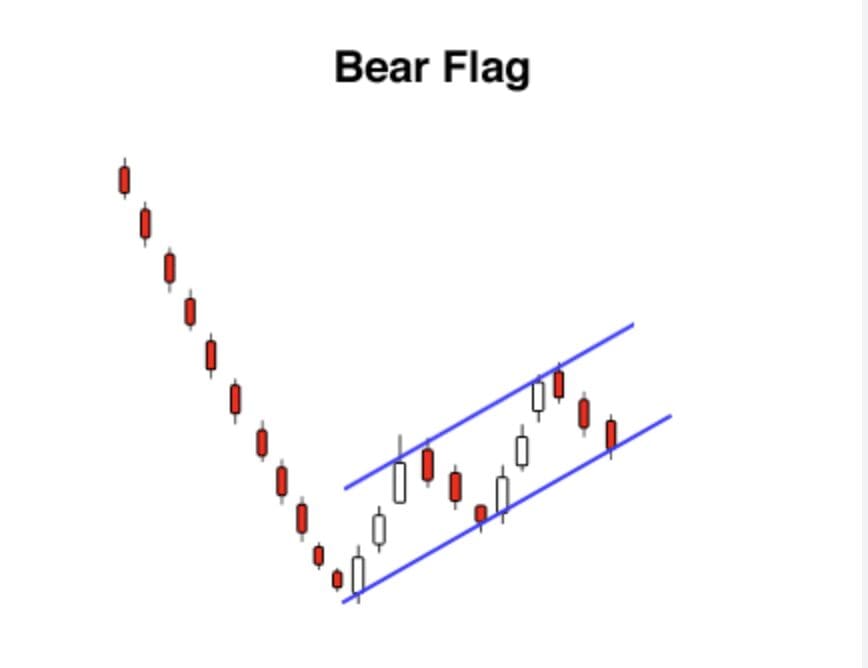
A Bear Flag Pattern: What Is It?
In contrast to a bull flag pattern, a bear flag pattern shows a downward advance initially followed by an upward consolidation within of a parallel channel. The upward consolidation channel is the bear flag itself, and the downward movement is known as the flagpole.
Meanwhile, the time when a bear flag forms frequently correspond with a drop in trade volume.

A Bear Flag Trading Pattern
The example that follows shows how to trade the bear flag pattern on cryptocurrency charts.

The price of bitcoin has created a flagpole in the chart above, followed by an upward retracement inside of an ascending parallel channel. Ultimately, the price of BTC descends to the height of the flagpole after breaking out of the channel range to the downside.
Traders have the option of waiting until the price falls below the lower trendline with increasing volumes before opening a short position on a decline from the flag’s upper trendline.
In either scenario, the short target is often calculated by deducting the flagpole size from the flag’s apex.
The price may regain the lower trendline as support for a potential rebound inside the parallel channel if there is a breakdown below the flag’s lower trendline that is accompanied by low volumes, which indicates a fakeout.
Setting a stop loss just above the entry levels is crucial to preventing losses in a fakeout scenario.
Disclaimer: There are no recommendations or investment advice in this article. Every trading and investment decision carries risk, so readers should do their own study prior to making a decision.